Analysis of Lydford weather
The graph below shows monthly rainfall for the last 2 years (blue) together with the 4 month moving average (orange).

The chart below shows average monthly rainfall by month, 1=January etc. NB. Large variations from year to year.

This chart shows the total rainfall in each year.

Records (since June 2007):-
Driest month: May 2020 at 2.3mm. Second driest is March 2025 at 6.0mm.
Wettest month: January 2026 at 169.5mm. Previous wettest were September 2024 at 166.5mm, and January 2014 at 165.8mm.
Wettest day: 18 June 2020 at 62.5mm
Highest annual rainfall was in 2024 at 1109.4mm, exceeding the previous record of 1079.3 in 2023
Highest temperature: 37.7C on 18 July 2022. Previous highest was 34.4C on 12 August 2020
Lowest temperature: -13.6C on 18/19 Dec 2010
Highest wind speed gust 124kph on 18 Feb 2022, 107kph on 7 Dec 2024
Latest weather news
March 2026Much drier - about a quarter of previous month's rainfall.
January -February 2026
Wettest month in the last 17 years. This has resulted in very serious flooding in Somerset particularly on the levels and other areas eg Taunton.
The first week of January was cold with temperature down to -8.1 on 4th and 6th Jan. Then warmer but much wetter weather set in. In February, wet weather continued with twice the average rain for the month.
December 2025
The month started very wet but then cold and dry from 22nd onwards. A cold new years eve saw a temperature of -5.8 and a maximum of -0.9C.
August - November 2025
Very dry and hot until the last week of August when rain returned. Then September was cooler and as wet as usual. October had below average rain for the month. November was much wetter with some sharp frosts.
June - July 2025
June and July were hot and dry with 35.0C on 12 July. We have now had 5 months of below average rainfall, and plants are suffering.
March - May 2025,
March was very dry and sunny with only 6mm of rain, the second lowest recorded. April and May were also very dry and warm, reaching 26C at end of the April..
Jan - Feb 2025
Initally cold (min -7.2C on 3 Jan) and then very wet with severe flooding locally. January had 162mm of rain and storms up to 80kph. Quieter weather in Feb, max of 16.2C on 22nd.
Nov - Dec 2024
Weather very variable - cold with minimum -4.5C on 20th, storm Bert on 24th with wind up to 93kph and max of +16.5C. Storm Darragh on 7 December caused damage to house tiles and brought down part of the Eucalyptus tree. Wind speed up to 107kph.
September - October 2024
September was the wettest month in 16 years! Not as wet as some places in England, but bad enough. Trees and plants love it, and have grown a lot more than usual. October continued with higher than average rainfall but also warmer.
August 2024
A dry month with one wet day making up more than half the monthly figure. Maximum temperature of 30.8C on 11 August.
June -July 2024
A return to drier weather although mostly cool in June. July reverted to wet weather - seemingly months alternate wet and dry! Warmest day was 31 July with 33.0C
29 Feb 2024 - May 2024
Exceptionally wet February - wettest since these records began in 2008. March continued the trend, wetter than average. April rainfall was about average, but May was wettest since these records began. May had 114.9mm compared with an average of less than 50mm.
18 Feb 2024
Heavy rain during the night - 35mm recorded resulting in severe flooding. River Brue - top of normal range 2.16m, above this some flooding expected - reached a depth of 4.01m. The A37 was impassable and traffic was diverting round the village over the bridge (below right).


The field behind our property. Road bridge


The weir can just be seen - the channel is about 20ft deep. The footbridge was just clear

The river had spread over the footpath.
Key events of the past
Feb 2022A series of severe storms occurred from 14th to 21st Feb. Most serious was Storm Eunice on 18th with maximum gust speed recorded of 124kph (77mph, 67knots) - highest wind speed recorded at this address. There was a further storm Franklin on 20th and 21st with gusts of 90kph. Eunice caused damage to the house roof and a power outage for 33hours.
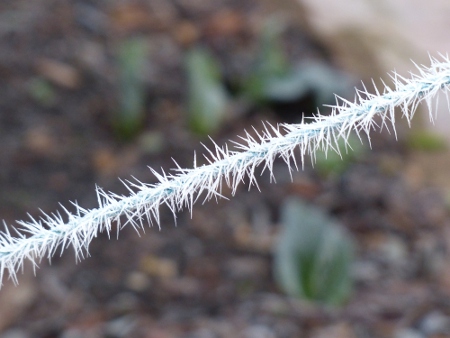
Jan 2021
A cold month, minimum of -6.3 on 1 Jan and many days with overnight below zero. 7 Jan notable for a maximum daytime temperature of -2.3C. Extreme frost - image shows "frosticles" on a guy rope.
June, July, August 2020
After the record dry May, we got a near record wet June, a total of 120.3mm and with the highest one day rainfall yet recorded here of 62.5mm on 18 June . July returned to a nearer average rainfall, and rather cool at times although a hot day on 31st at 30.7C. August had the hottest day so far on the 12th with 34.4C, followed by about 4 days of very humid weather with thunderstorms. Rainfall was high at 118.9mm.
May 2020
A record dry month - the driest since these records began in 2007, with only 2.3mm of rain.
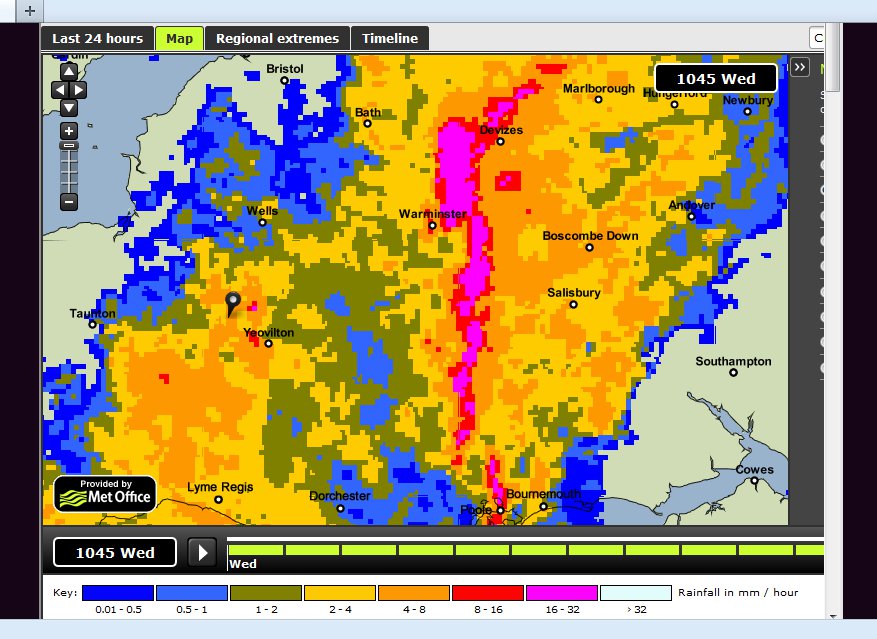
August 2019
Total for the month was 99.3mm. On 11 August a stream of thunderstorms with torrential rain resulted in rainfall of 51mm - the highest one day figure since these records began in 2007. The previous highest figure was 37mm on 24 July 2015. The weather map shows the line of storms which continued to move from SW to NE over the afternoon and evening.

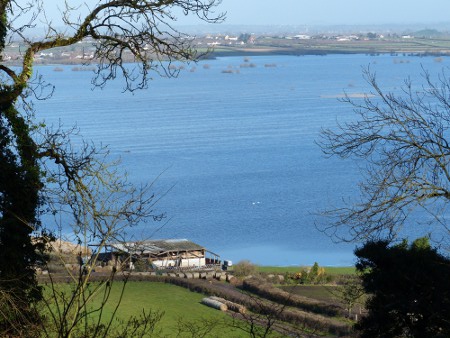
February 2014
A series of severe storms has caused widespread flooding, wind damage and travel disruption across southern England and Wales. Rainfall for the month totalled 140.8mm which is another very high figure (average for the month ~60mm). Notable wind gusts recorded here were 4 Feb - 93km/hr, 12 Feb - 106km/hr, 14 Feb - 100km/hr. [106km/hr ~ 66mph]
Shown below left are the Somerset levels - flooding at West Sedgemoor looking north towards Stoke St Gregory and Burrowbridge with Burrow Mump just visible at top right.

The image above shows flooding
of the River Parrett at
Langport.
January 2014Last month's record rainfall was exceeded this month to achieve a new record of 165.8mm. Serious flooding occurred on the Somerset levels, reaching national and international news. Detailed analysis is given below.
2012
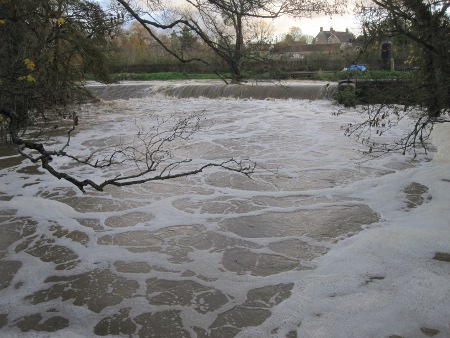
December was the wettest month for the last 5 years, at 140.7mm. Very serious flooding occurred throughout the country and Somerset fared badly. The fields are saturated, so that any further rain causes immediate run-off into adjacent property. On 21 November 2012, very heavy rainfall causes floods throughout Somerset and the west country. Lydford escaped lightly with "only" 42mm, compared with Okehampton's 92mm. Very high wind speeds all day with a peak gust here of 105kph (65mph). Many roads flooded and/or impassable. Seriously flooded roads encountered between Baltonsborough and Wells. River Brue at Lydford is up to the bridge arches again (see pic of May 2012 below).
The recently repaired lower weir at Lydford is seen here on 21 Nov 2012. The water in the foreground is ~20feet deep. Image on right is same weir on 18 Nov.

More info on the Lydford weir repair is at http://lydfordweir.org.uk/
August 2012 rainfall was 110.9mm, the wettest August since we started measurements in 2007.
29 August 2012 - a heavy band of rain passing through west to east depicted here. This is called a line echo wave pattern. The pin indicates Somerton. We recorded 30mm of rain that day.

River Brue at Lydford on 1 May 2012.